
In business, good data is the lifeblood of decision-making.
Companies, large and small, rely on information to make decisions. Over the past 18 years, Google Analytics has become the key tool for analyzing website activity, providing the data that drives business.
Google’s measurement solution made it fairly simple for even the most technologically challenged among us to analyze website visits, how that person arrived, how long they stayed, and so much more.
Until recently, these users were operating on Universal Analytics (UA). In the fall of 2020, Google released Google Analytics 4 (GA4), and both properties ran concurrently. At the time, the long-term goal was to shift users to the GA4 property.
Google Analytics 4 shifted the focus to user interaction rather than sessions, allowing business owners to gain better insights regarding a visitor’s behavior while learning more about the customer journey.
Google made the change to its system so businesses can better understand cross-platform behavior. AI-powered insights and more post-conversion data are now part of GA4, allowing brands to track engagement, retention, and monetization. GA4 also adapted to developing updates in privacy laws, working in accordance with the General Data Protection Regulation (GDPR).
Plan for the July 1, 2024 Transition

While this sounds scary and abrupt, don’t fret. Google has taken a number of steps to ensure users can export and retain their own historical data. You don’t need to be a tech expert to retrieve the data yourself.
3 Ways You Can Export Your Own Data
Google outlined three methods for users to capture data prior to the July 1, 2024, deadline. (The exception to these options is users on Analytics 360, who can export UA data and merge it with GA4.)

Option One: Export a Report
For many small businesses, this simple option will provide enough historical data. It’s important to be strategic about what information you capture. Focusing on specific timeframes or metrics allows you to export-focused reports for further analysis in other tools.
The export process itself is straightforward. Simply open the desired report in Google Analytics and apply your preferred date range and report settings (like which metrics you want to see). Click the “Export” button (located near the report title), and choose your preferred format (CSV, Excel, etc.).
For instance, if you’re particularly interested in user behavior during a specific marketing campaign you ran last quarter, you would:
- Open the “Acquisition” report.
- Filter by “Campaign Source” containing your campaign name.
- Set the date range to the specific quarter you want data for.
- Export the report with relevant metrics like sessions, bounce rate, and conversion rate.
By focusing on specific data points and following these steps, you can effectively capture valuable historical information from Universal Analytics before it becomes unavailable. The export utility allows you to choose from:
- CSV
- TSV
- TSV for Excel
- Excel (XLSX)
- Google Sheets
The file is generated automatically and available in the download directory on your computer.
An example is this output:
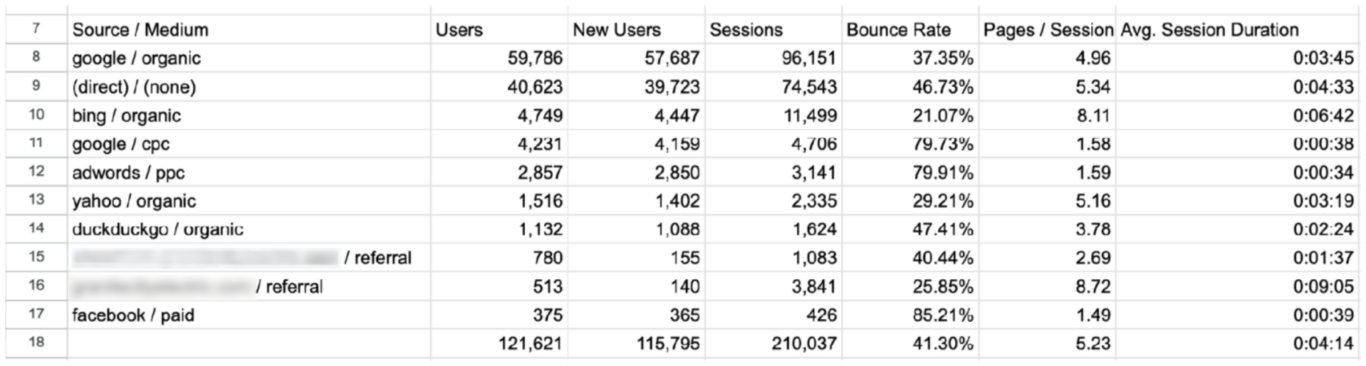 Represents the data of this exported report for UA for the selected time period.

Option Two: Install Add-On, Customize View ID, Run Report
Install the Google Sheets Add-on specifically for Analytics and follow this two-step process to archive data. This option is ideal for most businesses, and it can be accomplished rather efficiently.
Part A
- Create a new Google Spreadsheet (or open an existing one)
- From the menu bar choose: Add-ons > Get Add-ons
- Find the Google Analytics Add-on from the Add-ons gallery. Select it.
- From the Add-on description page, click the “+” in the top right corner to add this add-on to your spreadsheet.
- A dialog should pop up requesting your permission for the add-on to access your Google Analytics data. Click “Accept”.
- The Add-on is now installed. A Google Analytics submenu should now appear in the Add-ons menu.
Part B
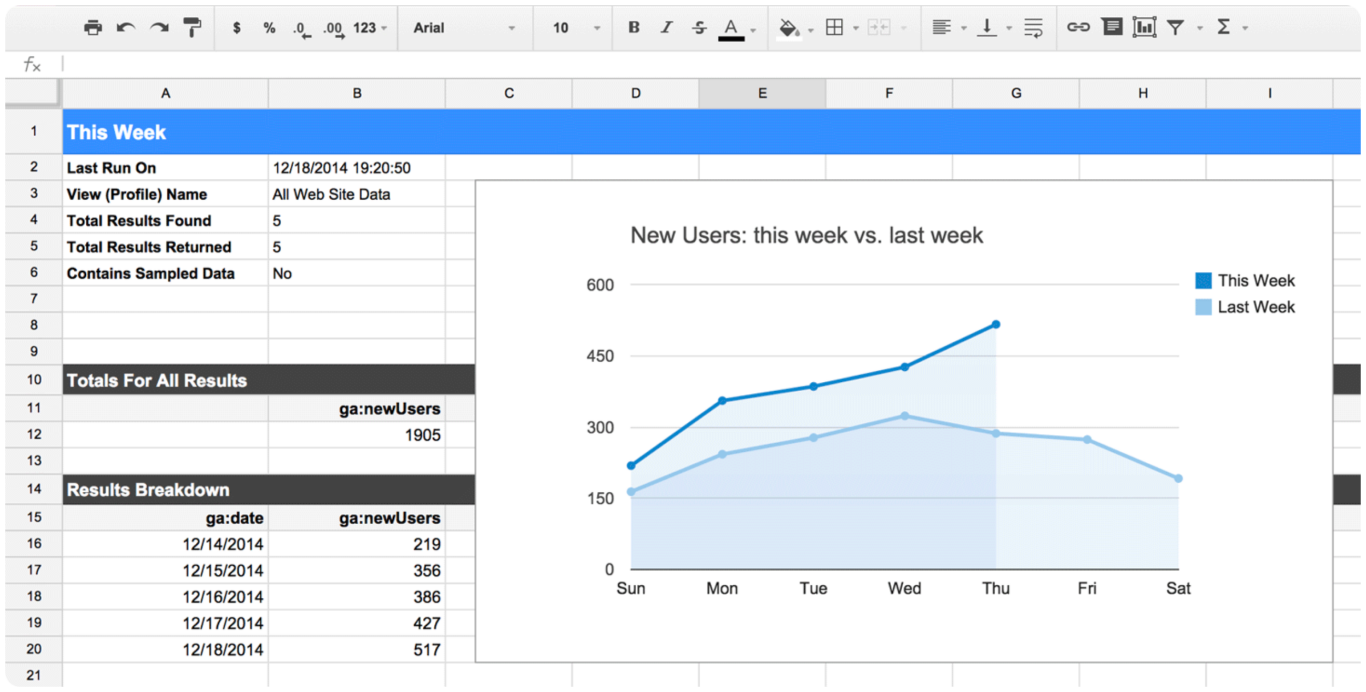
- Use this Google-created template report.
- Replace the View ID in row 3 (highlighted in yellow in the template link above) with the View ID for your property and update the date ranges. According to Google, adding significantly large date ranges may cause the Add-on to fail.
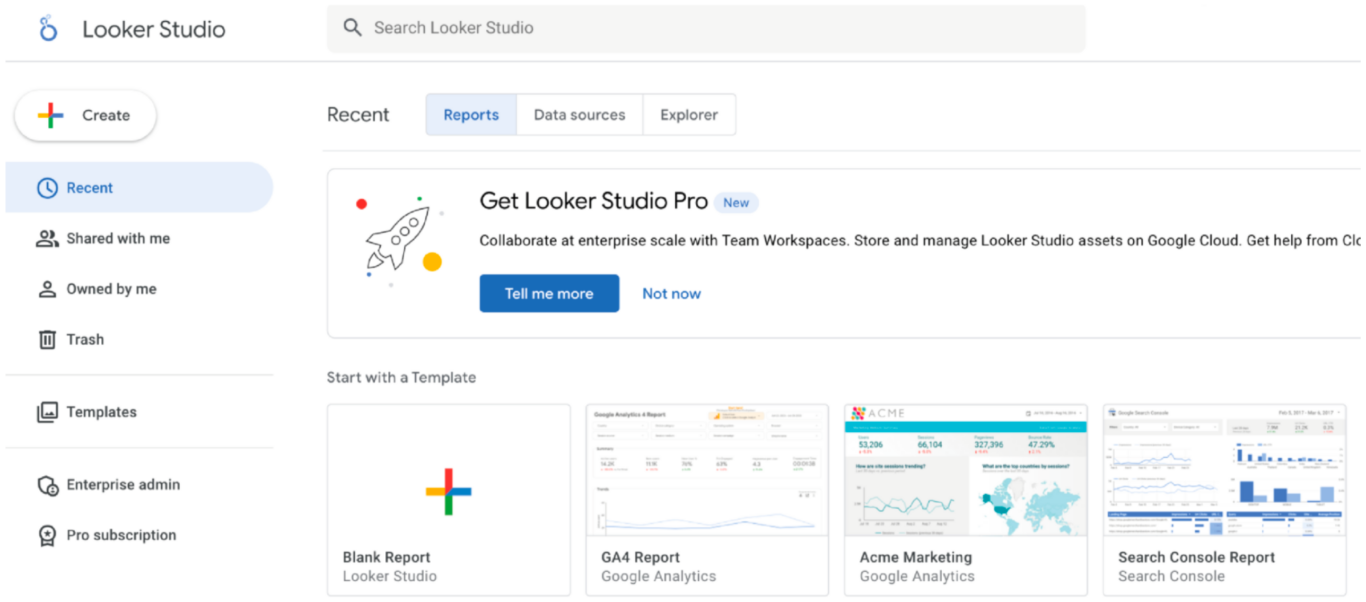
- Run the report. This will create tabs and reports for what Google says are the 12 most common data needs from UA. Once the report is complete, you can directly query this data in BigQuery or create dashboards from it using Google’s Looker Studio. You will need to repeat this process for every View whose data you want to archive.
We firmly believe that for most businesses, using the Google Analytics spreadsheet Add-on is the best option, even if you choose to implement others as additional options. It provides a wealth of information because it mixes the power of the Google Analytics API with the power of data manipulation in Google Spreadsheets.
Here’s some of what the tool can do:
- Query and report data from multiple views.
- Compute and display custom calculations.
- Create visualizations and embed those visualizations on third-party websites.
- Schedule your reports to run and update automatically.
- Control who can see your data and visualizations by using Google Sheets’ sharing and privacy features.
Option Three: Roll Up Your Sleeves… (You May Need Help from IT)
Google Analytics Reporting API v4 is the most complex choice, and it may require additional purchases from within Google’s platform, such as Google’s Cloud. Some business owners may not be tech-savvy enough to complete this option on their own, and it may require more data than is needed for their business.
Use the Google Analytics Reporting API to export data to Google’s Cloud storage and connect to Google’s Looker Studio. This API has options to pick a language and application type. With this option, users can build custom dashboards to display data, automate complex reporting tasks, and integrate GA data with other business applications.
New Ways to Assess Your Business
Session-Based vs. Event-Based Data
Universal Analytics primarily relies on session-based data. A session is a group of user interactions with your website or app in a given timeframe (usually 30 minutes by default). All user actions within that session are bundled together.
Imagine a user visiting your website and browsing different pages for 20 minutes. In session-based data, this entire 20-minute activity would be counted as one session.


On the other hand, GA4 focuses on event-based data. This means it tracks individual user interactions (events) such as page views, button clicks, video plays, etc., regardless of whether they happen within a specific timeframe.
Think of it like this: Every time a user performs an action on your website or app, an event is triggered and recorded by GA4. This provides a more granular view of user behavior.
Event-based data offers several advantages, including:
- Deeper User Insights: You can track a wider range of user interactions and understand user journeys in more detail.
- Cross-Platform Tracking: GA4 can track events across websites and apps, providing a unified view of user behavior.
- Improved Flexibility: Event-based data is more flexible and can be customized to meet your specific needs.
There’s predictive capabilities without complex models and direct integrations to media platforms help drive actions on a website or an app.
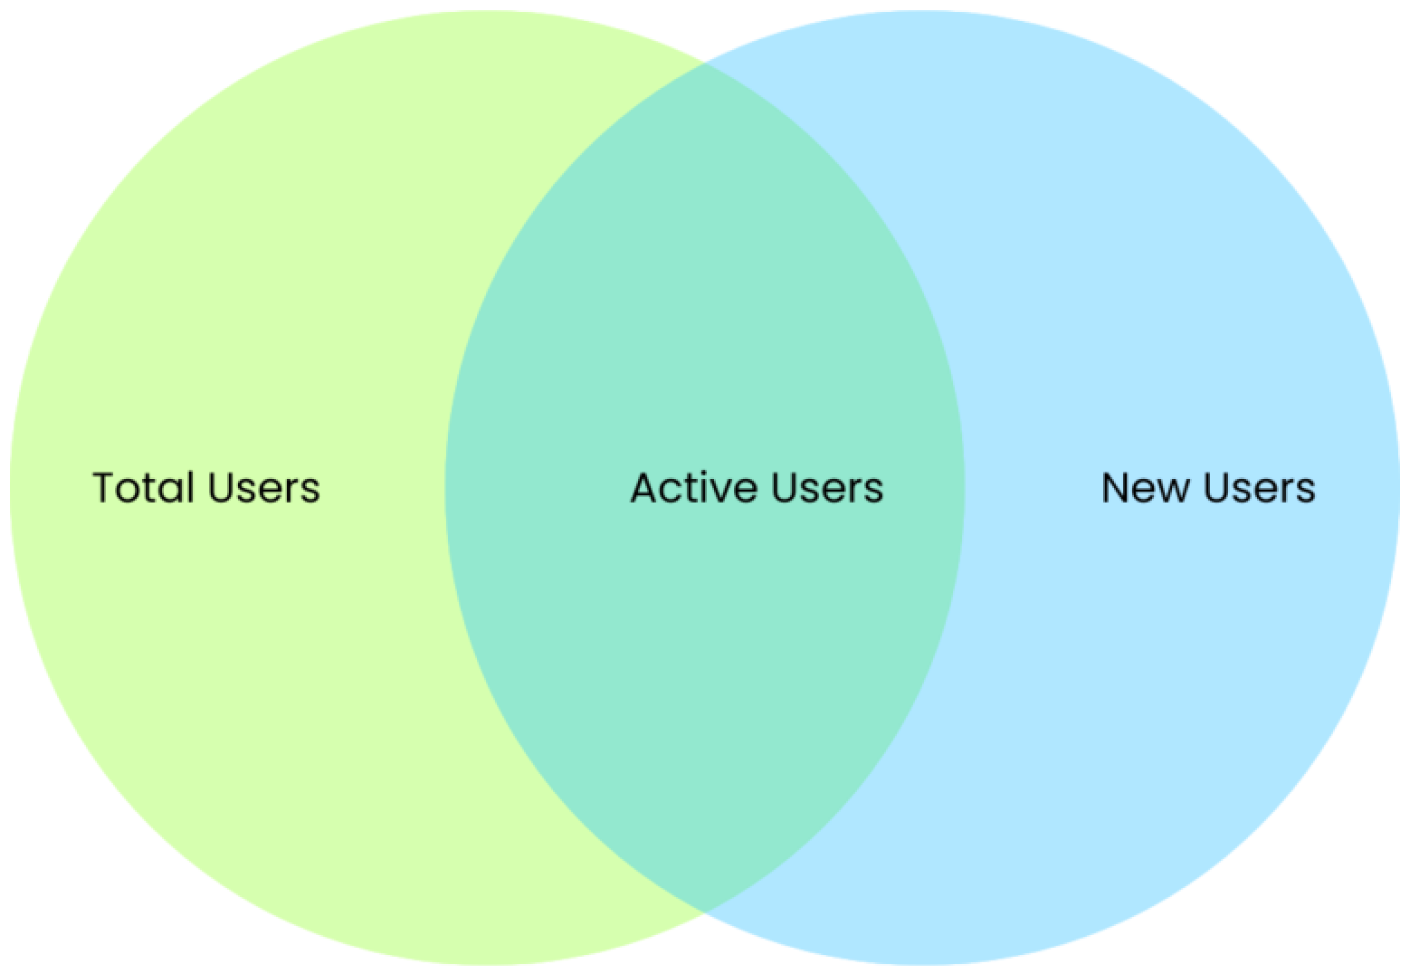
In UA, there are two User metrics. There are Total Users, and New Users. With the new GA4, there are three User metrics: Total Users, Active Users, and New Users.
The Total Users metric in UA and the Active Users metric in GA4 may be more or less similar, depending on how frequently users return to your website.
Google says that pageview discrepancies of up to 10% and user- and session-related discrepancies of up 20% can be expected and can depend on the filters you set. These discrepancies shouldn’t be a concern.
UA assessed five goal types: destination, duration, pages/session, smart goals, and event goals. Now, GA4 supports key events. UA counts only one key event per session, for the same goal. GA4 usually counts multiple key events per session, for the same key event. To reduce key event count differences between your UA property and corresponding GA4 property, update your GA4 key event counting method setting to once per session.
These are just some of the detailed changes that users are navigating with the new GA4. Remember, while both UA and GA4 offer valuable insights, understanding their core functionalities is crucial to avoid misinterpretations when referencing historical data in the future.
The Data You Really Need Before UA Goes Dark
While GA4 offers exciting new features, the exercise of gathering legacy data from UA before July 1st doesn’t necessarily mean capturing every data point available makes sense. It’s about prioritizing what truly matters for your business.
Here’s a suggestion on how to approach this:
- Focus on Trends, Not Mountains: Don’t get bogged down by collecting massive amounts of data. Look for patterns and trends over time (ideally 10+ years) to gain actionable insights.
- Pre-COVID Clarity: Consider the impact of COVID-19 on your data. Analyzing pre-pandemic trends alongside recent data can provide a more complete picture.
- The Car Dashboard Analogy: Just like you don’t need a complex car diagnostic report, you don’t need every UA metric. Identify key metrics that directly influence your business decisions, like overall traffic or visitor source.
Taking Action with Your Data
By July 1st, ensure you have this critical historical data secured. But more importantly, refine your focus on what truly matters:
- Identify Key Performance Indicators (KPIs): These are the essential metrics that gauge your business health. Examples might be conversion rates, customer acquisition costs, or lead generation numbers.
- Data-Driven Decisions: Leverage your historical UA data alongside insights from GA4 to make informed strategic choices that propel your business forward.
Remember: Data is only as valuable as the actions it inspires. Don’t just collect information; use it to create tangible results.